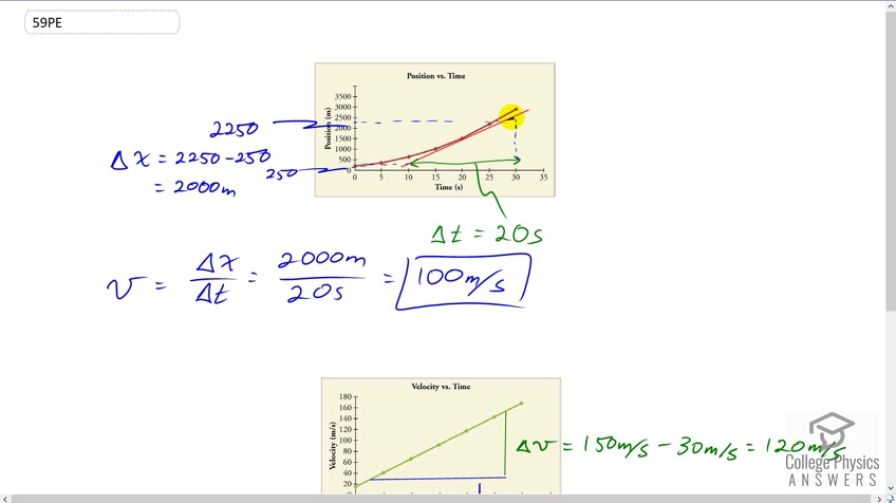
(a) By taking the slope of the curve in Figure 2.60, verify that the velocity of the jet car is 115 m/s at t=20 s. (b) By taking the slope of the curve at any point in Figure 2.61, verify that the jet car's acceleration is 5.0 m/s2.
This is College Physics Answers with Shaun Dychko. To find the velocity of this jet car at 20 seconds we need to take a tangent line of the graph at 20 seconds. So here's the 20 second mark here and I've drawn this tangent line in red here and the tangent touches the curve at one point and only one point. We find the slope of this tangent line. This is also the instantaneous velocity at 20 seconds. So the slope is the rise divided by the run, so the amount by which this line goes up, divided by the amount by which it goes sideways. We have the change in position seems to go from about here at about 250 meters up to about 2250 meters for a change in position of 2000 meters. For the run, it goes from about 10 seconds over to 30 seconds which make the change in time of 20 seconds, 30 minus 10. So the velocity is change of position divided by change in time, 2000 meters divided by 20 which is about 100 meters per second. Then to find its acceleration, we take the slope of the velocity versus time graph. The rise here -- now this is a bit of a technical point, but I've chosen to take my slope triangle to not use any of the data points because the reason this the line is being drawn, is the line is a kind of average of all the data points. So your analysis of your graph is better if you're using this average. Otherwise, if you take your slope triangle from particular points to another particular point, then you may as well not have even taken these other data points because they're not being used in any way. But if you take your slope between the points that are on just the line and not actual data points, then you're kind of -- this line is an average containing information from all of the data points. So all of the data points were useful. This is kind of a contrived graph obviously because you know, there is no real data that would have a line going perfectly through each point and so you don't really see any difference in this particular case. But it's a general best practice to take your slope triangle ending on the line itself and not on data points. Okay. So the slope is rise over run, the rise being the change in velocity and it looks like this goes from about 150 or so down to 30. That makes the change in velocity of 120 meters per second and the time over which that change of velocity occurs seems to end at about 27 seconds there and starting at about two, for a total of 25 seconds time interval. So acceleration is change of velocity over change of time, 120 divided by 25 giving an answer of 4.8 meters per second squared. So we've basically confirmed that the jet car is accelerating at 5 meters per second squared, ' cause that's pretty close to 5.
Comments
For part A) why are we using the distance at t=30 instead of t=20? Why isn't it (1500-250)/(20-0) instead you have (2250-250)/(20-0).
I had this same question and after working on it a bit, I think I know why for anyone else that comes across this problem (I recognize the original question was posted in 2020). Full disclaimer, I am just another student, not a professor or even someone that has taken higher level physics. So if this is wrong, hopefully someone will correct me :)
Finding (1500-250)/(20-0) would give us the instantaneous velocity of that particular moment in the motion of the car. We want to know the average velocity for which the car is moving. Which we can find from the slope of a tangent line to the curve of this graph. This is not the same as finding the instantaneous velocity or slope of the data involved in a moment in time of the car's motion. If you were to draw a tangent line and find the slope of THAT LINE (not the slope of one moment in time), then you get apprx. 115m/s. The slope should be the same along that line which is why this slope represents the average velocity of the car. The instantaneous velocities should all be different and will likely gradually increase second to second until a certain point and then decrease.