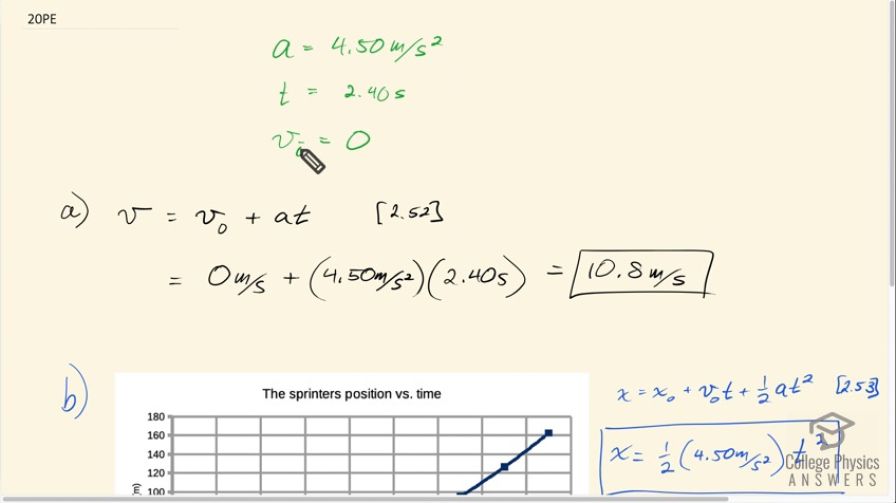
An Olympic-class sprinter starts a race with an acceleration of 4.50 m/s2 . (a) What is her speed 2.40 s later? (b) Sketch a graph of her position vs. time for this period.
This is College Physics Answers with Shaun Dychko. An Olympic runner who starts a race with an acceleration of 4.5 meters per second squared. Since they are starting the race, we can assume that their initial velocity, which I guess we call v naught , is zero and they are gonna be racing for 2.40 seconds. Part (a) asks us for the final speed so that will be the initial speed plus acceleration times time— that's equation 52 in chapter 2— and so that's 0 meters per second to start with plus 4.5 meters per second squared acceleration multiplied by 2.4 seconds giving 10.8 meters per second will be their final speed. And then to sketch a graph of their position vs. time, I used a spreadsheet program called the LibreOffice which is like a free version of Excel and it's here and I have put in some time's from 0, 0.5 second, 1 second, 1.5 seconds and so on and then the position is this equation which I'll explain over here; we have equation 53 in chapter 2 says that the final position is the initial position plus initial speed times time plus one-half times acceleration times time squared and in this case, they start at position 0 so that's 0. They start at rest so the v naught is 0 and so we have the acceleration of 4.5 meters per second squared multiplied by this half from the formula times t squared that's the formula that is here written as 0.5 times 4.5 multiplied by cell A3, which is the cell right beside where we are in column A at the same row and that's squared so that's this caret symbol which is 'Shift plus 6' and then the number 2 to say that it is to the power of 2. So this is one-half times 4.5 times time squared—that's the position. And then we made this chart; time on the horizontal axis, position on the vertical axis and we have the units of meters for position and seconds for time. And then I inserted a trend line to extrapolate between the points and then there we go that's the graph that's copied here and it has this equation.
Comments
how do we graph this without using a spreadsheet?
Hi kayla, thank you for the question. To graph without a spreadsheet you would first create a table of data with two columns. The first column would be labeled "time" with units of seconds, so it would be "time (s)", and the second column would be "position (m)". Then you would choose a sequence of times (I chose every half second between 0 and 8.5 s) and then use the formula in the video x=21(4.5)t to calculate the sprinter's position at each of the times. Then put the independent variable (which is the one you chose the values for. Time in this instance) on the horizontal axis of your graph, and the dependent variable (the one that was calculated. Position in this case) on the vertical axis and plot the (time, position) points from your data table.
Hope this helps,
Shaun