Question
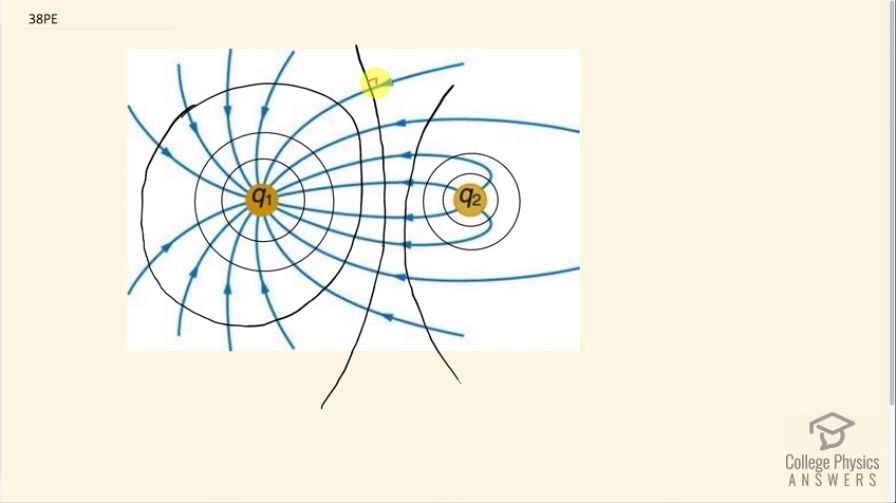
Figure 19.34 shows the electric field lines near two charges and , the first having a magnitude four times that of the second. Sketch the equipotential lines for these two charges, and indicate the direction of increasing potential.
Final Answer
Please see the solution video.
Solution video
OpenStax College Physics for AP® Courses, Chapter 19, Problem 38 (Problems & Exercises)
vote with a rating of
votes with an average rating of
.
Video Transcript
This is College Physics Answers with Shaun Dychko. One of the rules with drawing equipotential lines is to keep the equipotential line perpendicular to all the electric field lines so that's one thing I am keeping in mind as I draw these lines. Now with a single point charge here and looking at this left hand one, which has a charge of 3 times the magnitude of q 2, we would normally have concentric circles around this charge and the spacing between the circles would increase as you go to further away circles. But in this case between the charges, it will not be increasing its spacing because even though the change in potential requires a greater distance far from q 1, we are getting close to q 2, which is increasing the potential even more. So there's fairly even spacing in potential lines here although close to the charge, the spacing should be closer together. And this is because if you look at the potential versus distance of a single point charge, you have this kind of graph here where for a given change— vertically speaking— so this is a vertical change here between these two points, you have a certain amount of change in r—let's call this r 1— and for that same change in potential— same vertical change in other words between these two points here— we now have a greater change in r so r 2 is greater than r 1 and so this is another way of explaining how the equipotential lines have a greater space between them as you go further away from a single point charge. But this gets complicated by the fact that there are two charges. Now on the left side of q 1, I am trying to illustrate that increasing distance because each of these intervals between equipotential lines is meant to be the same so this is the same change in potential between consecutive lines and this change here might be r 1— that distance is r 1— and then this distance is r 2 and these are the spatial distances between points of equal interval in potential so equipotential difference. So on the left side of q 1, we are showing what you would expect from this graph for a single point charge but between these charges, it doesn't follow quite that pattern because q 2 is adding some more potential as you go further away from q 1 towards q 2. And so keep the equipotential lines perpendicular to the electric field lines is another bit of guidance in how to draw them and I should add that potential is increasing from here q 1 towards q 2 so this is the direction of increasing potential.