Question
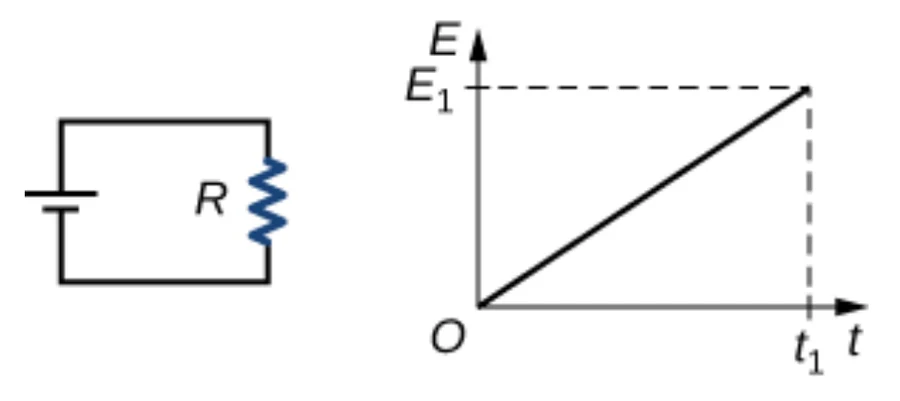
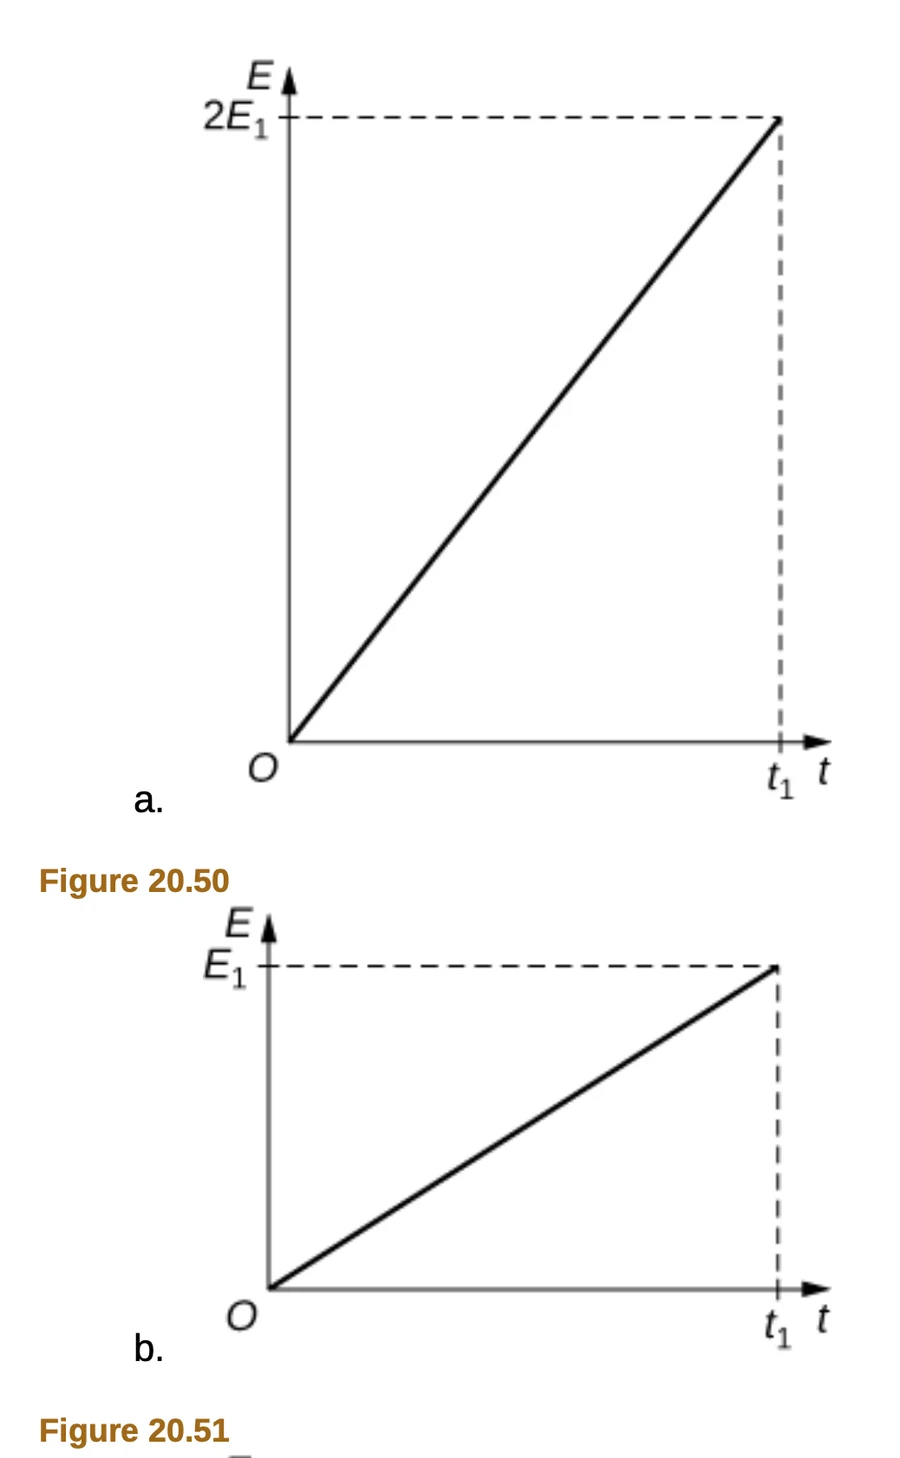
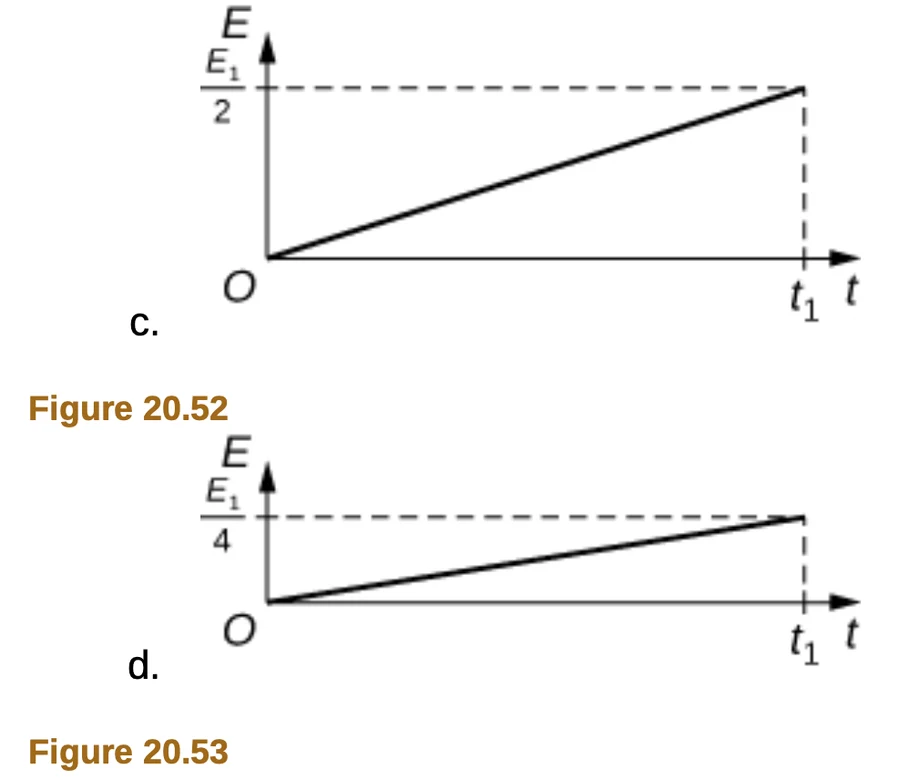
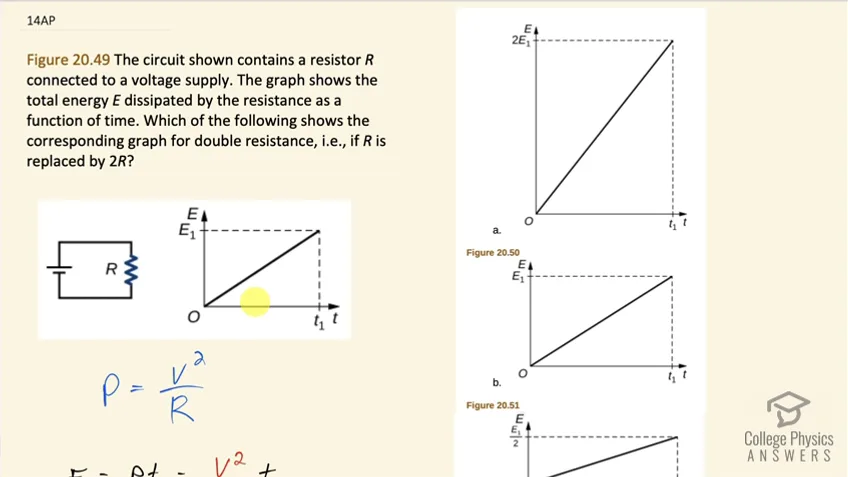
Figure 20.49 The circuit shown contains a resistor R connected to a voltage supply. The graph shows the total energy E dissipated by the resistance as a function of time. Which of the following shows the corresponding graph for double resistance, i.e., if R is replaced by 2R?
Final Answer
(c)
Solution video

This is a 17-second preview. Get access to the full video by starting your free 7-day trial.
This is a 17-second preview. Get access to the full video by starting your free 7-day trial.
Video Transcript
This is College Physics Answers with Shaun Dychko. A circuit with a battery and a single resistor has this graph for the energy dissipated as a function of time. Now we have a formula for the power dissipated by this resistor and it's the voltage squared divided by its resistance and the energy is going to be the power multiplied by time so we can substitute V squared over R in place of P and it's multiplied by t and E 1 which will be this maximum amount of energy on this graph at a time of t 1 is going to be V squared over R times t 1. The energy in the second scenario where this resistor is replaced with a resistor that is 2 times the original resistance is going to be the same voltage because there's nothing changed about the battery so that's V squared the time will be the same because we are looking for what this maximum will be here so we have t 1 for the time and we are going to divide by a different resistance, which is the resistance in the second case which we are told is 2 times the original resistance and all of this V squaredt 1 over R is E 1 so we can replace all that with E 1 and we are dividing it by this 2 here and so we can see that E 2 at its most will be E 1 over 2. So the graph will be version (c) here for the case where the resistance doubles.
Comments
No comments yet.