Question
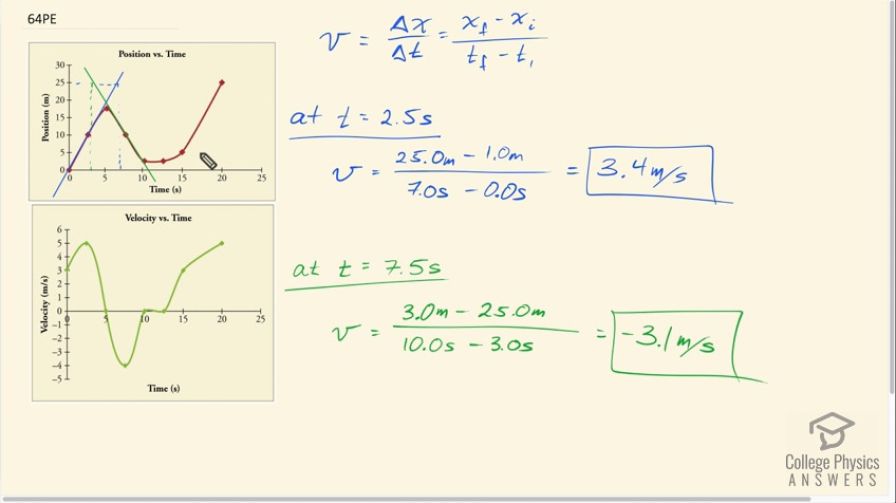
(a) Take the slope of the curve in Figure 2.76 to find the jogger's velocity at t = 2.5 s . (b) Repeat at 7.5 s. These values must be consistent with the graph in Figure 2.77.
Final Answer
at
at
Solution video
OpenStax College Physics for AP® Courses, Chapter 2, Problem 64 (Problems & Exercises)
vote with a rating of
votes with an average rating of
.
Calculator Screenshots

Video Transcript
This is College Physics Answers with Shaun Dychko. Given this position-time graph, we are going to figure out the speed of this object at 2.5 seconds and then we'll do it again at 7.5 seconds. So the instantaneous velocity is what we are going to be figuring out and we are going to do that by finding the slope of a tangent line to the position-time graph at these times. So we'll begin with the 2.5 second time and our tangent line is shown in solid blue here and a tangent line touches the graph at one point only and does not cross through it and so it is the slope of the graph at that particular point in time. So we have this blue line and we need to find its slope in other words because its slope is going to be its change in position— that is the rise, in other words— divided by its change in time which is the run because the horizontal axis is time; when you talk about slope being rise over run— if these are familiar terms from math class— in this particular case of this physics graph, rise over run is now change in position over change in time; okay and so that makes it velocity. So we choose any points that we think are convenient along this blue solid line and we find the difference between the y-coordinates of those points. So we have this point here and this point here that I'm considering and so the x-final is going to be 25 meters minus the x-initial which is about 1 meter and then we divide that by the time between those two points. So this final point here is at about a time of 7 seconds and an initial time of 0 seconds so 7 minus 0 in the denominator; this makes 3.4 meters per second and that is positive because well this works out to be positive and we know it's a slope that is up and to the right. Okay. Then at 7.5 seconds, we find the tangent line to the point on this position-time graph at 7.5 seconds and that's this green solid line here and our job now is to find the slope of this green solid line. So we have 3 meters is the final y-coordinate so we are considering this point here and then back over here at this point. So the final point has a y-coordinate of 3 meters or a position of 3 meters and then we subtract the initial position which is 25 meters and then we divide by the change in time between those two points. So this point is at 10 seconds minus the 3 seconds of our initial point and this works out to negative 3.1 meters per second and the negative indicates that the velocity is in the negative direction— it's moving backwards you might say. And these values that we have calculated are somewhat consistent with this velocity-time graph that's provided for us. The velocity-time graph agrees really well at this particular point here, this apex of the position-time graph where we know the velocity is zero and that lines up with 0 here at 5 seconds on the velocity-time graph. For 2.5 seconds, we have calculated 3.4 meters per second where this graph shows something close to 4.5 or so and well, you know, we are gonna stick with what we have calculated and just recognize that when you are doing, sort of, manual work like this or with graphs, you can't expect to have perfect agreement with other things that you are comparing to. Okay. And negative 3.1 for the velocity at 7.5 seconds, let's compare that. So at 7.5 seconds, we are having a negative velocity so certainly we agree on the sign definitely that has to be consistent otherwise we would say they do not agree but yeah we have negative in our calculation and we have negative in this graph here of velocity-time and it's not too far off, you know, this is showing about negative 4 meters per second and we have negative 3.1; we are gonna call that close enough to be consistent.