Question
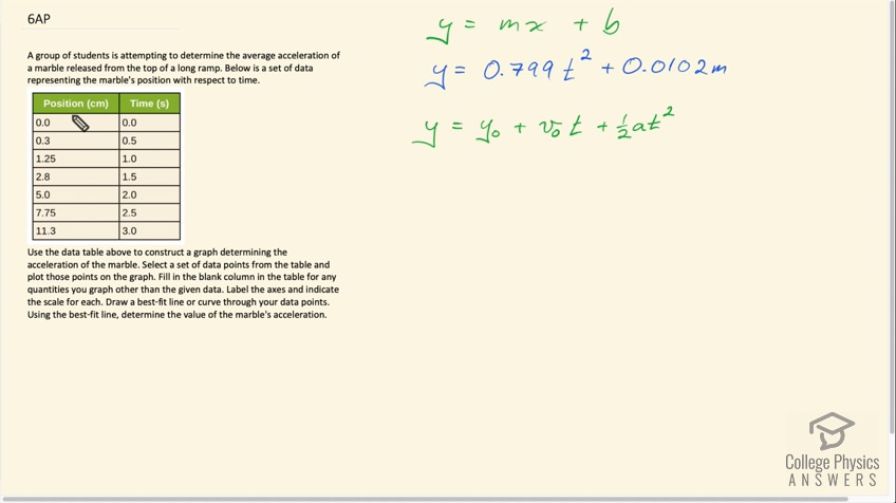
A group of students is attempting to determine the average acceleration of a marble released from the top of a long ramp. Below is a set of data representing the marble's position with respect to time.
Use the data table above to construct a graph determining the acceleration of the marble. Select a set of data points from the table and plot those points on the graph. Fill in the blank column in the table for any quantities you graph other than the given data. Label the axes and indicate the scale for each. Draw a best-fit line or curve through your data points.
Using the best-fit line, determine the value of the marble's acceleration.
Final Answer
Solution video
OpenStax College Physics for AP® Courses, Chapter 2, Problem 6 (Test Prep for AP® Courses)
vote with a rating of
votes with an average rating of
.
Calculator Screenshots

Video Transcript
This is College Physics Answers with Shaun Dychko. A marble is released from the top of a ramp and it rolls down the ramp and accelerates along the way and here is its position along the ramp, its distance from the starting point and here's the time that it's at each of these positions and the question is figure out the marble's acceleration given this information by plotting it on a graph. Now we could plot position vs. time but that would result in a parabola shape like this, the dots would be along a parabolic path and we know that because the position vs. time will be given by this equation where its position is the initial position which is zero in this case so this term is basically gone although we'll see in the best-fit line in this graph, we do get some small number there but I mean, we'll get to that in a second. So our position is the initial position plus the initial velocity which we are told is zero because it's released at the top of the ramp and so that word 'released' means initial velocity is zero and then we add to that one-half times acceleration times time squared. So the equation for a parabola is dependent on the variable squared and so this is how we know we'll get a parabola if we plot position vs. time because we have time squared in our equation and anything with a variable squared gives a parabolic shape. So we don't want to plot a parabola because if we did, it would be challenging to create a best-fit line for this; I mean, you know, since the points I have drawn are on a nice curve, it's fairly straightforward to draw the best-fit but if the points are scattered around, it's kinda hard to tell where exactly to put the best-fit. Suppose for example, the dots are like this... do we draw a best-fit line this way or do we draw it this way it's kinda hard to tell, they are both sort of kind of average out at all these points but on a straight line however, it is fairly easy to create a best-fit line that creates an average of all the points and we can get a straight line by adding a time squared column. And so this is Google Sheets by the way— and you can see a link in the quick answer to the sheet and get your own copy if you like— and you see that this cell has a formula which is B2 to the power of 2 and this is B3 to the power of 2 and so this is the time squared in this column. And this graph is plotting the position versus the time squared and results in a straight line because this whole thing, this t-squared is the x-axis variable and that makes this coefficient of t-squared one-half a, in other words, the slope because this is now slope-intercept form where x is time squared and m is the factor in front of the variable squared and then this b is the y-intercept which should be zero but it's not precisely zero in our best-fit here. So we have created a graph in slope-intercept form where x is times squared. Okay. So that means that all of this one-half a is the slope m and we are given that slope in the spreadsheet; the spreadsheet has told us that this best-fit line, trend line it's called, is 1.25 and so we can say one-half a equals 1.25 and so we can solve for a by multiplying this by 2 and this by 2 and we get a is 2 times 1.25 which is 2.5 meters per second squared and that's the acceleration of the marble.