Question
| Height (m) | Time (sec) |
| 0.490 | 0.1 |
| 0.882 | 0.2 |
| 1.176 | 0.3 |
| 1.372 | 0.4 |
| 1.470 | 0.5 |
| 1.470 | 0.6 |
| 1.372 | 0.7 |
A ball is launched at an angle of 60 degrees above the horizontal, and the vertical position of the ball is recorded at various points in time in the table shown, assuming the ball was at a height of 0 at time t = 0.
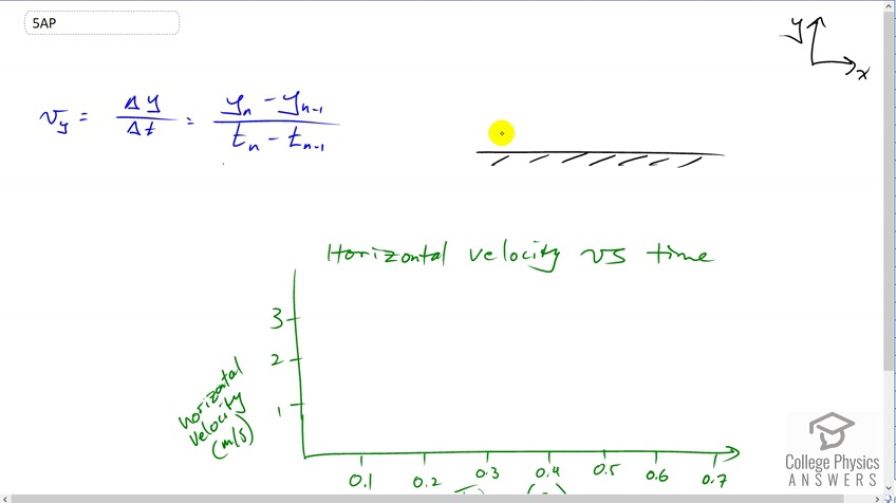
a. Draw a graph of the ball's vertical velocity versus time. b. Describe the graph of the ball's horizontal velocity.
c. Draw a graph of the ball's vertical acceleration versus time.
Final Answer
a) & b) see video for descriptions.
c) The ball's vertical acceleration is constant, and negative. The graph will be a horizontal line at
Solution video
OpenStax College Physics for AP® Courses, Chapter 3, Problem 5 (Test Prep for AP® Courses)
vote with a rating of
votes with an average rating of
.
Video Transcript
This is College Physics Answers with Shaun Dychko. We’re told that a ball is launched at a 60 degree angle above the horizontal and some data is taken. The data is the vertical position of the ball at different times. Here is the data table and I’ve added zero second and zero height because it does tell us that at t equals zero, the height is zero so we can add that to the data table. And here is the other data copied from the question. Now if we make a velocity-time graph for the vertical direction, we can figure out what the velocity is during each time interval. We’ll find the average velocity. That’s this formula here, it’s the, well velocity is the change of position over the change of time. So for any particular time interval, the nth time interval, we’ll take the y position at that interval minus the y position at the interval before, then divide by the time at which the nth measurement was taken minus the time at which the previous measurement was taken. That is also shown here in this formula, the formula bar where to find the velocity at the time 0.05, which is the average time between the beginning and end of the interval, we’re going the height at the end of the interval minus the height at the beginning of the interval, and then divide by the amount of time that’s passed. This gives us a whole bunch of velocities and we see that there is a zero velocity at this time, which we expect because the height is the same at these two different times, so somewhere during this time interval, somewhere between 0.5 and 0.6, it must have reached the maximum height which is not 1.47, it’s something a little bit more than that. Sure enough we’re showing that at 0.55 seconds, which is between 0.5 and 0.6, we’re getting a velocity of zero so this confirms that what we’re doing over here must be correct. Though it’s a bit strange that that’s a positive. Well this formula isn’t quite working out the way it’s supposed to because the denominator here, it doesn’t know what to do with the fact that there’s no number here. It’s looking for a number here, and they’re going minus 0.7. So we’re gonna fix that a little bit. I removed that last line on there because we can’t calculate with the velocity is because we have no two different heights to compare. The formula looks for the velocity at the end of the time interva l minus the velocity at the beginning, or the height at the end minus the height at the beginning. For after 0.65, there is no height here to compare to. Here is our data table for velocity at these different times. When plotted as a graph, you see this. An x intercept somewhere between 0.5 and 0.6 should be shown on your graph and an y intercept somewhere close to 4.9 or 5 or so. That’s the velocity near the beginning. And then, it also asks us to make a graph of the horizontal velocity versus time. We don’t have any data except to say that if we assume that it’s launched towards the right, then we’ll have a positive horizontal velocity and it’ll be constant at all times because we know there is no acceleration horizontally so that could be the graph of horizontal velocity versus time.