Question
Design an experiment to verify the relationship between the average force exerted on an object and the change in momentum of that object. As part of your explanation, list the equipment you would use and describe your experimental setup. What would you measure and how? How exactly would you verify the relationship? Explain.
Final Answer
Please see the solution video.
Solution video
OpenStax College Physics for AP® Courses, Chapter 8, Problem 10 (Test Prep for AP® Courses)
vote with a rating of
votes with an average rating of
.
Video Transcript
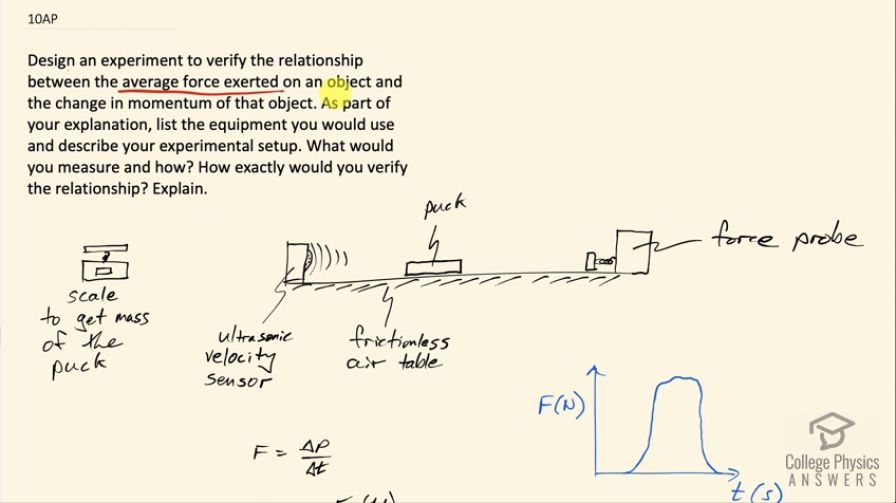
This is College Physics Answers with Shaun Dychko. Our job in this question is to design an experiment that verifies the relationship between average force on an object and the change in momentum of that object so we are gonna list the equipment that we need and describe how the experiment would work. So we'll need a scale to measure the mass of this puck that we are going to have on a frictionless air table and we'll have an ultrasonic velocity sensor [that] probably measures velocity using maybe the time it takes for the sound to rebound and we'll also have a force probe, which will sense how much force is applied on the puck when the puck hits the force probe. So the puck will be given some initial velocity to the right here and it will stay at that velocity throughout the slide since this is a frictionless air table then it will hit the probe and then rebound and we will measure what its final velocity is after it rebounds. And meanwhile when it's hitting the force probe that force probe will create a graph of the force that it applies versus time and it will look something like this... it will quickly ramp up to some high force and then quickly fall back down as the puck leaves the force probe on the rebound. So... we know that the change in momentum of the puck is the force multiplied by time or at least this is what we are trying to verify and force multiplied by time for a messy graph like this is best found by taking the area underneath this graph because we don't have just a distinct, constant force exerted for a distinct amount of time like in idealized questions; if this is a real-world graph, this picture is gonna be a little bit more messy. So we are going to take the area under this graph to get the product of force and time and do this several times for different initial velocities and plot the integral, which is the calculus term for area under this graph plot this area versus change in momentum, which we figure out by, you know, comparing mass times final velocity minus mass times initial velocity based on the information from the velocity sensor and then that is a different graph here, where you have the area under the force-time curve on this axis and then you have the change in momentum on this axis and you have dots for each initial velocity and what you expect is to get a straight line with a slope of 1 which is what would be expected if this relation were true that the change in momentum is force times Δt... you know, this is y equals mx plus b I suppose—that's, you know, the slope-intercept form for a straight line equation— and b is 0 if you are close to the origin m would be 1 and x would be F times Δt and then y is this ΔP. Okay! So the steps— to be more clear—is number 1 you would have a puck sent towards the force probe at a known velocity and then the force probe would measure the force on the puck versus time so you generate this graph, the puck return velocity would be measured and then you would be able to figure out what is the change in momentum based on knowing the mass by weighing the thing on the scale first of all and then figuring out the initial and final velocities and figure out the change in momentum that way and plot that change in momentum versus this area under the force-time graph and verify that the slope is 1.